Currency Rates

Ad Sense


03 April 2011

Bharti Airtel Ltd.

The market cap of Bharti Airtel Ltd. is 134945.23 Cr., the EPS(TTM) is 21.09 , the P/E ratio is 16.85 and that of industry is 16.48.

Weekly Chart

The weekly chart of Bharti Airtel Ltd. shows that it is moving in the broad range of 310.12 to 362.77.The MACD has crossed above the signal line above the zero level. The RSI is moving in the upwards direction above the 50% level. The Stochastic is also moving in the upwards direction signaling the buy on the weekly chart basis but the resistance is strong at the level of 362.77, if the stock could break this level and sustain there then only it will go higher. There is strong support at the level of 340.44 giving by the 20 and 100 week moving averages.

Daily Chart


The Daily chart of Bharti Airtel Ltd. shows that the stock is returning back from the upper resistance level of 362.77, The RSI is returning back towards the 70% level and Stochastic is returning back from the 80% level, the overbought region, showing that the stock will further correct to a level of 340.44. 

Conclusion: One can sell this stock for a target of 340.44 with a stop loss of 362.77, the closing on 1 Aprl 2011 is at 355.30.

02 April 2011

Bharat Petroleum Corporation Ltd (BPCL)

The market cap of BPCL is 21938.38 Cr., the EPS(TTM) is 36.36 , the P/E ratio is 16.69 and that of industry is 9.58.

Weekly Chart

 
Weekly chart of BPCL shows that it has started to rise after correction.It is trading between the support provided by the 100 week simple moving average at thelevelof 584.25 and resistance at the level of 627.MACD is about to cut signal line in above direction.The RSI is rising, Stochastic %D has crossed the Smoothed %D in above direction near the 20% leve, giving the buy signal. 

Daily Chart


 Daily chart of BPCL shows that the stock is correcting in the short term say since the last three days.The stock will  take support at the levels of range 575.84 to 584.25, the support provided by the 20 day and 50 day simple moving averages respectively. The MACD is showing bullish signs while the RSI and Stochastic shows that the stock is overbought as both are above the 70% and 80% levels respectively and are in the downward direction showing correction in short term.After taking support at the levels 575.84 to 584.25,it will regain it's upward move towards 627 levels.

Recommendation: One must buy this stock at a level of 584 after correction and stock is moving in upwards direction for a target of 627 with a stop loss of 3 to 5%.


01 April 2011

BHEL

The market cap of BHEL is 103477.19 Cr., the EPS(TTM) is 104.65 , the P/E ratio is 20.20 and that of industry is 21.13.

Weekly Chart

 The weekly chart of BHEL shows that the stock has started to rise after correction. There is resistance at a level of 2155.56, caused by the 20 week simple moving average, then the next level of resistance is at 2297.22 caused by the 100 week simple moving average.The MACD has crossed the signal line above,the RSI is moving towards 50% and stochastic has emerged above the 20%. All this conclude that a buy signal is given by the indicators.


Daily Chart


The daily chart shows that the closing on 1 Aprl 2011 is at 2127.7, the resistance is at 2155.56.The MACD has crossed the signal line above, the RSI is near the 70% level, The stochastic is above the 80% level, the overbought region. All this conclude that the up move will continue after a minor correction or consolidation.

Recommendation: One can buy BHEL above the levels of 2155.56 with a target of 2297.20 with a stop loss of 3 to 5%according to one's risk appetite. 

30 March 2011

Axis Bank Ltd.

 The market cap of axis bank is 58385.78 Cr., the EPS(TTM) is 76.32, the P/E ratio is 18.65 and that of industry is 29.16.

Weekly Chart


Weekly chart of Axis Bank Ltd. shows that after correction and conolidation for some weeks the price has started to move up.The support is at a level of 1376.65. The resistance are at a level of 1455.12 and 1569.41. The MACD has crossed above the signal line and MACD histogram is rising. The RSI is rising and above the 50%. The Stochastic is near the 80% level, the overbought region, the stock may correct near the level of 1455.12.

Daily Chart


Daily chart of Axis Bank ltd. shows that it has given a break out from the level of 1376.65.The stock is trading above all the moving averages of 20,50,100 and 200 day. MACD has crossed above the signal line and is above the zero line, the RSI is near the 70% level, Stochastic is above the 80%,the near resistance level is at 1455.12,near this level the stock can correct or consolidate.

Recommendation: One can buy this stock at a level of 1455.12 for a target of 1569.41 with a stop loss of 3 to 5%.

28 March 2011

BAJAJ AUTO LTD.

Weekly Chart

 
Weekly Chart of Bajaj Auto Ltd. shows that it is about to enter into up move, there is resistance at the level of 1429.34. The volumes are decreasing but the stock has crossed the resistance caused by 20 day simple moving average. The MACD has crossed above the the signal line, the slope of the histogram is positive.The RSI is near the 50% level.The Stochastic is above the 50% level.All this indicates bullishness in the stock.

Daily Chart


Daily Chart of Bajaj Auto Ltd. shows that there is resistances at a level of 1429.34, once it is crossed then the next resistance for the stock is at 1540.88. The volume in the stock is rising since last few days and the the closing price is also rising every day which shows the returning faith in the stock.The MACD has crossed the signal line above and the slope of histogram is rising. RSI is above the 50% and stochastic %D has crossed above the Smoothed %D near the 20% level giving the buy signal.

Recomendation: One can buy the stock near the level of 1429 for the target of 1540 keeping a stop loss of 3 to 5% according to one's risk appetite.

22 March 2011

ACC LIMITED

The ACC Ltd. has resistance at the level of 1021 posed by the 100 day simple moving average and support at 1000 by the 20 and 50 day simple moving average. Both the RSI and slow stochastic are in the overbought region and has started to inch down singling the minor correction or side ways movements for a short term.  

19 March 2011

NIFTY

The nifty is moving in the range of 5200 to 5600. It is trading blow all the moving averages of 20,50,100 and 200 simple day moving averages. MACD is trading blow the zero line and MACD has crossed the signal line downward indicating sell signal. RSI(14) has changed it's direction downward. The Stochastic is also in the downward direction towards 50% level. All this shows that the Nifty will move towards 5200 psychological level, once this level is breached the next level will be 4830.

11 February 2011

BSE SENSEX 30


BSE SENSEX is correcting and has fallen through the 200 day simple moving average.The bears are dominating over the bulls. The down trend is confirmed by the rising ADX, as it is trading above 35 level. MACD has crossed below the zero line. RSI and Stochastic both are in over sold region. The next support levels for SENSEX are 16551.11 and 15986.33.

10 February 2011

Gold


As I have mentioned in my previous post on 20 January 2011, that the gold is forming the bearish chart pattern “The Triple Top” . The gold has corrected up to $1308.10/oz on 28/1/2011 and it has moved up to $1366.80/oz on 9/2/2011. It is now facing the resistance due to the 50 day simple moving average. The RSI is above 50 level and MACD has crossed signal line but below the zero line this indicates mild bullishness.The Gold may remain side ways or some minor correction, then it will resume its upward move. Near term target for the Gold is 1394.36.

09 February 2011

S&P CNX NIFTY update

The S&P CNX NIFTY is in down trend. It has fallen through all the moving averages say 20, 50, 100 and 200 day and the major support of 5400 and now it is certain the it will fall through the 5208 - 5210 support.As all the major indicators indicates that. The -DI has crossed above the +DI and the ADX is rising near to 40. The MACD is making lower lows and lower high and MACD has crossed the zero line and is blow the zero level. RSI and Stochastic both are in oversold region and may remain their as the sentiments are bearish and more selling may come. The next level of support is 4944.      

01 February 2011

S&P CNX NIFTY


The nifty has fallen in down trend.It is trading below 200 day simple moving average. The RSI is making lower lows and lower highs the same is true for the MACD. RSI is trading blow 50 level and is at 28.91 and MACD is trading blow the zero line. All this indicate that bears are winning the game and dragging the nifty downwards. Once the important level of 5400 is breached, the weakness will be more visible and the next support level will be 5210.

26 January 2011

French CAC 40 Index

French CAC 40 Index is in up trend. It is trading above all the three simple moving averages say 20 day, 50 day and 100 day, same is true for 200 day moving average. The RSI is heading towards the overbought zone say above 70 level. The slow Stochastics has entered the overbought zone say above the 80 level. MACD is all ready above the zero line. All this shows that the bulls are dominant and the up trend will remain intact though some correction may take place.

25 January 2011

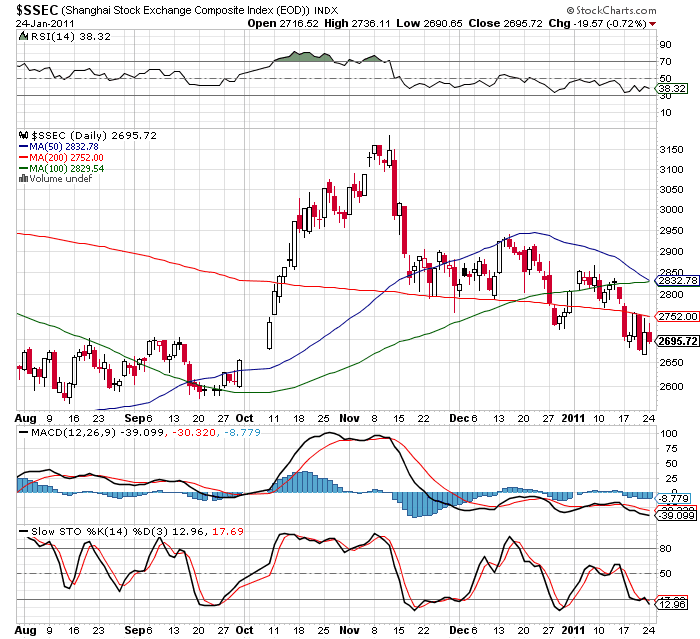
Shanghai Stock Exchange Composite Index


The Shanghai Stock Exchange Composite Index has fallen in down trend. It is trading blow all the simple moving averages say 50 day, 100 day and 200 day, The down trend is confirmed by making lower lows and lower highs. The RSI is making lower lows and is below the 50 level. MACD has crossed the signal line and trading blow the zero line.Slow Stochastics is also making lower highs and is in oversold region. The bulls have lost fight in the hands of bears. The next support level is at 2564.

22 January 2011

Tokyo Nikkei Average Index

via StockCharts.com

The Nikkei is correcting. It has been in up trend since September 2010. Recently the RSI has touched the 70 level and started to fall down and currently at 45.27. MACD has crossed the signal line below. Slow stochastic has dropped from the over bought region and is below 50 level. All are the bearish signs. The correction can be deeper. If Nikkei breaks below the support provided by the 50 day simple moving average at 10204.81 then the next support will be at 9896.79 by 200 day simple moving average. The overall structure of Nikkei is positive and there is no reason of worry until it breaks through the support provided by 200 day simple moving average.

21 January 2011

Review On Nasdaq Composite Index


Nasdaq Composite Weekly Chart


I n the weekly chart, the Nasdaq composite is trading in strong up trend. The RSI(14) is returning from the overbought region; the 70 level and now is at 68.20, the slow stochastics is also in the overbought region. The MACD histogram is also sloping down. Volumes are decreasing. All this show some correction is possible.

Nasdaq Composite Daily Chart
The above observation ,”A small correction is possible” is confirmed by the daily chart of Nasdaq Composite. The RSI(14) has dipped below the 70 level and is at 55.94 level and the MACD has crossed below signal line. The slow Stochastic has also dipped blow the 80 level, the overbought level. All this conclude that correction has started. The price has broken the support given by the 20 day simple moving average in intra day basis. The next support is at 2621.32 by 50 day simple moving average.

20 January 2011

Gold Forming Triple Top Chart Pattern


The Gold is forming Triple top chart pattern from 9 Nov 2010 to 3 Jan 2011. This is bearish chart pattern. The Gold is trading at 1369.68 on closing basis, there is strong resistance at the level of 1395.04 posed by the 20 and 50 day simple moving averages. The support is at 1346.76 by the 100 day simple moving average.

The RSI(14) is forming descending high or in down trend, trading below 50 level, which is bearish sign. The same is true for MACD. MACD has crossed blow signal line and is trading below zero level.

All this confirms that there is still weakness left in gold.

Advanced Trend Lines with S & R

This AFL draws support and resistance lines with trend lines. Just save it in your custom folder of Amibroker and drag and drop in blank pane.
_SECTION_BEGIN("Advanced Trend Lines");
function GetXSupport(Lo, Percentage, Back)
{
 return ((BarCount - 1) - LastValue(TroughBars(Lo, Percentage,Back)));
}
function GetYSupport(Lo, Percentage, Back)
{
 return (LastValue(Trough(Lo, Percentage, back)));
}

function GetXResistance(Hi, Percentage, Back)
{
 return ((BarCount - 1) -LastValue(PeakBars(Hi, Percentage, Back)));
}
function GetYResistance(Hi, Percentage, Back)
{
 return (LastValue(Peak(Hi, Percentage, Back)));
}
function TD_Supply(P)
{
    return ( P > Ref(P, 1) AND P > Ref(P, -1) AND P > Ref(C, -2));
}
function TD_Demand(P)
{
    return ( P < Ref(P, 1) AND P < Ref(P, -1) AND P < Ref(C, -2));
}
////////////////////////////////////////////////////////////////////////
//Parameters
Percentage     = Param("Percentage", 1.5, 0.01, 100. ,0.01);
DrawAllLines     = ParamToggle("Draw All Lines?", "No|Yes");
Lines             = Param("Lines?", 1, 1, BarCount-2);
DrawR             = ParamList("Resistance Points", "Off|High to High|High to Low", 1);
DrawS             = ParamList("Support Points", "Off|Low to Low|Low to High", 1);
ShowTDP         = ParamToggle("Show TD Pionts", "No|Yes", 1);
AllOrDownR     = ParamToggle("Resistance Direction", "All|Down");
AllOrUpS         = ParamToggle("Support Direction", "All|Up");
ShowSR            = ParamToggle("Show Vert S/R","No|Yes", 1);
SRPer            = Param("S/R Percentage", 3, 1);
SRBack            = Param("S/R Back", 5, 1);
str = "";
Res = Sup = 0;
Con = 1;
////////////////////////////////////////////////////////////////////////
Main = C;
Con = ConS = ConR = 1;
if(DrawS=="Low to Low")
{
    Support1 = L;
    Support2 = L;
}
else
{
    Support1 = L;
    Support2 = H;
}
if(DrawR=="High to High")
{
    Resistance1 = H;
    Resistance2 = H;
}
else
{
    Resistance1 = H;
    Resistance2 = L;
}
////////////////////////////////////////////////////////////////////////
//Plotting Area
Plot(Main, "", IIf(C>O,colorGreen, colorRed), styleCandle);
if(DrawAllLines)
for(i = 2; i<=Lines+1; i++)
{
    if(DrawS!="Off")
    {
        x0 = GetXSupport(Support1, Percentage, i);
        x1 = GetXSupport(Support2, Percentage, i-1);
        y0 = GetYSupport(Support1, Percentage, i);
        y1 = GetYSupport(Support2, Percentage, i-1);
        x = LineArray(x0, y0, x1, y1, 1);
        if(AllOrUpS) ConS = StrToNum(NumToStr(y0 < y1));
        if(Con AND ConS)
            Plot(x, "", IIf(LastValue(C) < LastValue(x), colorBlue,colorLightBlue),
styleLine|styleThick);
    }
    if(DrawR!="Off")
    {
        x0 = GetXResistance(Resistance1, Percentage, i);
        x1 = GetXResistance(Resistance2, Percentage, i-1);
        y0 = GetYResistance(Resistance1, Percentage, i);
        y1 = GetYResistance(Resistance2, Percentage, i-1);
        x = LineArray(x0, y0, x1, y1, 1);
        if(AllOrDownR) ConR = y0 > y1;
        if(Con AND ConR)
            Plot(x, "",  IIf(LastValue(C) < LastValue(x), colorBlue,colorLightBlue),
styleLine|styleThick);
    }
}
else
{
    if(DrawS!="Off")
    {
        x0 = GetXSupport(Support1, Percentage, Lines+1);
        x1 = GetXSupport(Support2, Percentage, Lines);
        y0 = GetYSupport(Support1, Percentage, Lines+1);
        y1 = GetYSupport(Support2, Percentage, Lines);
        x = LineArray(x0, y0, x1, y1, 1 );
        Sup = LastValue(LinRegSlope(x, Lines+1));
        if(AllOrUpS) ConS = y0 < y1;
        if(Con AND ConS)
            Plot(x, "", IIf(LastValue(C) < LastValue(x), colorBlue,colorLightBlue),
styleLine|styleThick);
    }
    if(DrawR!="Off")
    {
        x0 = GetXResistance(Resistance1, Percentage, Lines+1);
        x1 = GetXResistance(Resistance2, Percentage, Lines);
        y0 = GetYResistance(Resistance1, Percentage, Lines+1);
        y1 = GetYResistance(Resistance2, Percentage, Lines);
        x = LineArray(x0, y0, x1, y1, 1 );
        Res = LastValue(LinRegSlope(x, Lines+1));
        if(AllOrDownR) ConR = y0 > y1;
        if(Con AND ConR)
            Plot(x, "",  IIf(LastValue(C) < LastValue(x), colorBlue,colorLightBlue),
styleLine|styleThick);
    }
str = "\nR Slope=("+Res+"), S Slope=("+Sup+")";
}

if(ShowTDP)
{
    PlotShapes(TD_Supply(H)*shapeSmallCircle, colorRed, 0, H, H*.001);
    PlotShapes(TD_Demand(L)*shapeSmallCircle, colorGreen, 0, L, -L*.001);
}
if(ShowSR)
{
    for(i=1; i<=SRBack; i++)
    {
        x0 = GetXSupport(L, SRPer, i);
        x1 = BarCount-1;
        y0 = GetYSupport(L, SRPer, i);
        x = LineArray(x0, y0, x1, y0, 0);
        Plot(x, "", IIf(LastValue(C) > x, colorDarkGreen, colorDarkRed),
styleLine|styleDashed|styleThick);
        x0 = GetXResistance(H, SRPer, i);
        y0 = GetYResistance(H, SRPer, i);
        x = LineArray(x0, y0, x1, y0, 0);
        Plot(x, "", IIf(LastValue(C) > x, colorDarkGreen, colorDarkRed),
styleLine|styleDashed|styleThick);

    }
}
Title =FullName()+" ({{NAME}})\n{{DATE}}\n"+"Open: "+O+", Hi: "+H+", Lo: "+L+",
Close: "+C+StrFormat(" (%.2f  %.2f\%)", C-Ref(C, -1), SelectedValue(ROC(C,
1)))+str;

_SECTION_END();

14 January 2011

Murrey Math Price Lines


Click to enlarge image.

Use it as an indicator on price chart in Amibroker. The line will show reversal points on the chart.
_SECTION_BEGIN("Murrey Math Price Lines");
/*
//       $Archive: /AFL.root/AFL/YofaTrader/Custom/Murrey Math Price
Lines.afl.cs $          
//          $Date: 08.03.29 22:57 $        
//       $Modtime: 08.03.29 22:52 $      
//      $Revision: 15 $     
//      $Workfile: Murrey Math Price Lines.afl.cs $       
*/

ParamShowLevel=ParamList("Show harmonic levels", "1/8|1/4|1/2", 1 );
ParamShowLabel=ParamStyle("Show harmonic labels", styleNoLabel, styleNoLabel);

if(Status("action") ==1)  //indicator
{
    LastVisibleIndex = LastValue(Status("lastvisiblebarindex"));
    if (LastVisibleIndex > BarCount -1) //to avoid errors is case of cursor is behind the last bar
        LastVisibleIndex = BarCount-1;
    TotalVisibleBars = LastVisibleIndex -
LastValue(Status("firstvisiblebarindex")) + 1;
}
else
{
    LastVisibleIndex = BarCount -1;
    TotalVisibleBars = BarCount;
}

HHScreen = HHV(High, TotalVisibleBars);
LLScreen = LLV(Low,  TotalVisibleBars);
PRScreen = HHScreen[LastVisibleIndex] - LLScreen[LastVisibleIndex]; //Price range

PriceRangeVisible = PRScreen * 1.1;
MiddleVisible = (HHScreen[LastVisibleIndex] + LLScreen[LastVisibleIndex]) /2;
HighestVisible= MiddleVisible + PriceRangeVisible / 2;
LowestVisible = MiddleVisible - PriceRangeVisible / 2;

SquareBase = 0.1953125;

if (HighestVisible > 0.390625)
    { SquareBase = 1.5625; }

if (HighestVisible > 1.5625)
    { SquareBase = 3.125; }
   
if (HighestVisible > 3.125)
    { SquareBase = 6.25; }
   
if (HighestVisible > 6.25)
    { SquareBase = 12.5; }
   
if (HighestVisible > 25)
    { SquareBase = 100; }
           
if (HighestVisible > 250)
    { SquareBase = 1000; }
   
if (HighestVisible > 2500)
    { SquareBase = 10000; }
   
if (HighestVisible > 25000)
    { SquareBase = 100000; }

ShowLevel = 1;

PriceStep = SquareBase / 8;
while ( PriceRangeVisible / 4 <= PriceStep AND ShowLevel < 4)
{
    PriceStep = PriceStep / 8;
    ShowLevel++;
}

//Lowest,highest harmonic value to show on the panel
LowerValue  = floor(LowestVisible  / PriceStep) * PriceStep;
HigherValue = ceil(HighestVisible / PriceStep) * PriceStep;

Octave1PriceStep = SquareBase / 8;
Octave2PriceStep = SquareBase / 64 ;
Octave3PriceStep = SquareBase / 512;

Harmonic = LowerValue;

//iterate from low to high values
while( Harmonic <= HigherValue )
{
    style = styleDashed; // 1/8, 3/8, 5/8, 7/8 lines of any level
    color = colorGreen;  //1/8, 7/8
    if ((Harmonic / PriceStep) % 8 == 1 OR (Harmonic / PriceStep) % 8 == 7)
        color = colorYellow; // 3/8, 5/8
    if (ParamShowLevel != "1/8")
        style = styleNoLine;
       
    if ((Harmonic / PriceStep) % 2 == 0) // 1/4, 3/4 lines of any level
    {
        style = styleDashed;
        color = colorPink;
        if (ParamShowLevel == "1/2")
            style = styleNoLine;
    }
    
    if ((Harmonic / PriceStep) % 4 == 0) // 1/2 line of any level
    {
        style = styleDashed;
        color = colorBlue;
    }
   
    if ((Harmonic / PriceStep) % 8 == 0) // 1/1 line of Baby level
    {
        color = colorBlue;
        style = styleLine;
        if ((Harmonic / Octave3PriceStep) % 64 == 0) // 1/1 line of Minor level

        {
             style = styleThick; // 1/1 /Level Minor
        }
    }
   
    if (style != styleNoLine)  //if there is a line to plot... (avoid printing unused labels)
    {
        style = style + ParamShowLabel;
        Plot( Harmonic, "", color, style);
    }
   
    Harmonic = Harmonic + PriceStep;
}
_SECTION_END();

13 January 2011

SILVER On 13 Jan 2011


via StockCharts.com


The silver has corrected and taken support at 28.32 at 20 day simple moving average on 7 Jan 2011 and now it is has started to move up since three days. The RSI is rising and above the 50 level at 55.43. Today the silver has broken the resistance cause by the 20 day simple moving average and the closing is at 29.65 on 12 Jan 20011. The silver is in strong up trend.The recent target for the silver is 31.21 in short term.

Dow Jones Industrial

As I have mentioned the Dow Jones Industrial is trading in the strong up trend and there is on need to worry. All the early signs of weakness has gone away. After taking support at 20 day simple moving average, it has started to move up to the psychological 12,000 level.