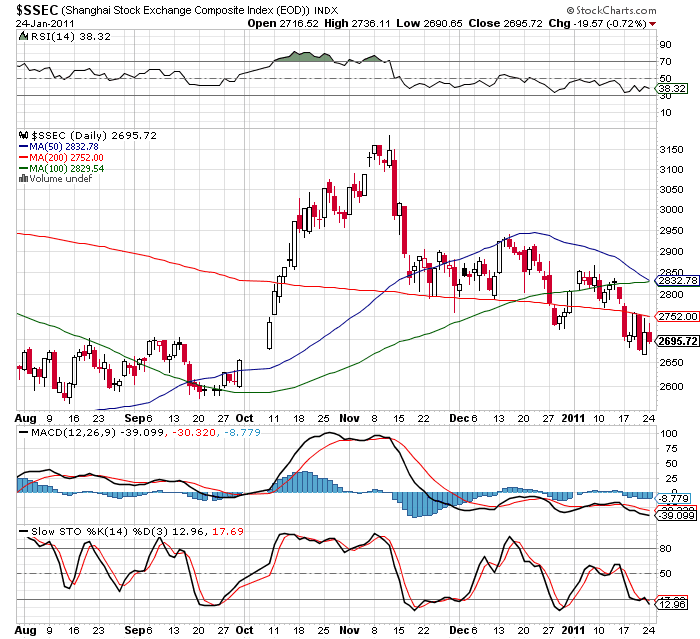
The Shanghai Stock Exchange Composite Index has fallen in down trend. It is trading blow all the simple moving averages say 50 day, 100 day and 200 day, The down trend is confirmed by making lower lows and lower highs. The RSI is making lower lows and is below the 50 level. MACD has crossed the signal line and trading blow the zero line.Slow Stochastics is also making lower highs and is in oversold region. The bulls have lost fight in the hands of bears. The next support level is at 2564.
This blog shares technical, views and data about different Currencies, Gold, Silver, Oil and Indexes.
Currency Rates
Ad Sense
Showing posts with label simple moving average. Show all posts
25 January 2011
21 January 2011
Review On Nasdaq Composite Index
Nasdaq Composite Weekly Chart
I n the weekly chart, the Nasdaq composite is trading in strong up trend. The RSI(14) is returning from the overbought region; the 70 level and now is at 68.20, the slow stochastics is also in the overbought region. The MACD histogram is also sloping down. Volumes are decreasing. All this show some correction is possible.
Nasdaq Composite Daily Chart
The above observation ,”A small correction is possible” is confirmed by the daily chart of Nasdaq Composite. The RSI(14) has dipped below the 70 level and is at 55.94 level and the MACD has crossed below signal line. The slow Stochastic has also dipped blow the 80 level, the overbought level. All this conclude that correction has started. The price has broken the support given by the 20 day simple moving average in intra day basis. The next support is at 2621.32 by 50 day simple moving average.
Labels:
MACD,
nasdaq composite,
resistance,
RSI,
simple moving average,
support
13 January 2011
Dow Jones Industrial
As I have mentioned the Dow Jones Industrial is trading in the strong up trend and there is on need to worry. All the early signs of weakness has gone away. After taking support at 20 day simple moving average, it has started to move up to the psychological 12,000 level.
10 January 2011
Dow Jones Industrial
Dow Jones Industrial is trading in strong up trend. It is trading above all the simple moving averages say 20, 50, 100, 200 day simple moving averages. Though some minor signs of weakness are visible on the chart as it has closed below the openings for two days, +DI has changed the direction below and the MACD is flat but until it does not break through the 20 day simple moving average, there is no need to worry.
Labels:
Dow Jones Industrial,
MACD,
simple moving average,
Up trend
01 January 2011
BSE Mid Cap Index-MIDCAP
The BSE Mid Cap index, MIDCAP has broken through the resistance of 7669.64 and trading above 200 day simple moving average. It has started to rise after a correcton. The MACD has crossed above the signal line but still is below the zero line. The RSI is also rising and is at 48.13. The +DI has crossed -DI in above direction, all these are bullish signs. The only major combined resistance posed by 50 and 100 day simple moving average is at 8041.04. From level 7669.64 to 8041.04 i.e. 4.84%, there is no resistance, One can trade safely in this period in selective mid cap stocks. After this level is broken then the bulls will be in dominance.
Labels:
ADX,
MACD,
Mid cap,
RSI,
simple moving average
BSE Small Cap Index-SMLCAP
After a correction, the small cap index has started to rise. The MACD has crossed the signal line above but still trading below zero line. The RSI has started to rise and now at a level of 48.73. The index is currently above 200 day moving average. The only major combind resistance posed by 50 day moving average and 100 day moving average is at 10,096.97. It is safe to trade in selective small cap stocks for a upside of about 6% in short term.
Labels:
MACD,
RSI,
simple moving average,
small cap index
Subscribe to:
Posts (Atom)


