Currency Rates

Ad Sense


Showing posts with label down trend. Show all posts

04 January 2011

ONGC


The ongc is forming descending triangle formation. There is resistance posed by the three simple moving averages say 20, 50 and 100 day. This resistance is pretty difficult to break. The support are due to 200 day simple moving average at 1240.84 and the another resistance level at 1204.69. The MACD is trading below the zero line and has crossed below the signal line. RSI is also sloping down and trading at43.74. The -DI has crossed below +DI and ADX is at 30.42 . All these indicators shows that the stock may go down further. The up side is limited than the down side.

The market cap of the stock is 275700.67 cr.The PE Ratio of the stock is 17.38 and that of industry is 16.72. The EPS(TTM) of the stock is 74.24. The yearly financial results ending Mar 2010 and quarterly financial results ending September 2010 are satisfactory.

Recommendation: If stock goes below the level of 1204.69 with volumes then one can short this stock for a target of 1137 with a stop loss of 1180.

03 January 2011

Bhushan steels


Click to enlarge the image.
The above chart is shown after adjusting the stock split.
After taking support at 20 day and 100 day simple moving average, the stock has started to rise . The only minor resistance is due to 50 day simple moving average. Once this resistance is crossed it will have next resistance at the level of 540 which will be its target in short term.The MACD has crossed above the signal line. The RSI is rising. +DI will soon cross -DI above.There are some bullish and some bearish sign but the overall picture is in favor of buy.

The market cap of the stock is 10293.01.The PE Ratio of the stock is 11.03 and that of industry is 11.78. The EPS(TTM) of the stock is 43.94. The yearly financial results ending Mar 2010 and quarterly financial results ending September 2010 are good only EPS is decreased.

Recommendation: One can buy this stock for a target of 540 and with a stop loss of 452. The closing price on 31-12-2010 was 473.90.

LIC Housing Finance

Click image to enlarge.


The above chart is shown after adjusting the stock split.

The stock has taken the support at a level of 165. The stock price is above the 20 day simple moving average. The MACD has crossed above the signal line. The RSI is rising. +DI will soon cross -DI above.There are some bullish and some bearish sign but the overall picture is in favor of buy.

The market cap of the stock is 9315.26 .The PE Ratio of the stock is 2.29 and that of industry is 31.65. The EPS(TTM) of the stock is 85.67. The yearly financial results ending Mar 2010 and quarterly financial results ending September 2010 are good.

Recommendation: One can buy this stock for a target 219 of and with a stop loss of 185. The closing price on 31-12-2010 was 195.40. Once the first target is met, the other targets are 228.19 and 244.58.

02 January 2011

YESBANK


The YESBANK is having support at 20 day simple moving average and 200 day simple moving average at 304.10. The MACD has crossed above the signal line and trading at -5.69. The RSI is rising and trading at 47.11. The +DI has crossed above the -DI. All this indicate early buy signal. The combined resistance posed by 50 day and 100 day simple moving average at 330.81.

The market cap of the stock is 10795.97 .The PE Ratio of the stock is 18.03 and that of industry is 28.80. The EPS of the stock is 17.34.

Recommendation Closing price on 30-12-2010 is 312.70. One can trade in this stock for a target of 330.81 and a stop loss of 304.10 for short term.

29 December 2010

BSE BANKX


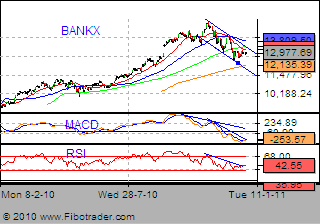
The BSE sectoral index BANKX has set in the down trend and trading in the down channel. BANKX is trading blow it's 100 day moving average. The MACD is making lower lows and is way below zero line at -253.57. The RSI is also making lower lows and is below 50 level at 42.55. The only sign of bullishness is that it is trading above the 200 day simple moving average one it is below this then the down trend will be more confirmed.