Currency Rates

Ad Sense


11 February 2011

BSE SENSEX 30


BSE SENSEX is correcting and has fallen through the 200 day simple moving average.The bears are dominating over the bulls. The down trend is confirmed by the rising ADX, as it is trading above 35 level. MACD has crossed below the zero line. RSI and Stochastic both are in over sold region. The next support levels for SENSEX are 16551.11 and 15986.33.

10 February 2011

Gold


As I have mentioned in my previous post on 20 January 2011, that the gold is forming the bearish chart pattern “The Triple Top” . The gold has corrected up to $1308.10/oz on 28/1/2011 and it has moved up to $1366.80/oz on 9/2/2011. It is now facing the resistance due to the 50 day simple moving average. The RSI is above 50 level and MACD has crossed signal line but below the zero line this indicates mild bullishness.The Gold may remain side ways or some minor correction, then it will resume its upward move. Near term target for the Gold is 1394.36.

09 February 2011

S&P CNX NIFTY update

The S&P CNX NIFTY is in down trend. It has fallen through all the moving averages say 20, 50, 100 and 200 day and the major support of 5400 and now it is certain the it will fall through the 5208 - 5210 support.As all the major indicators indicates that. The -DI has crossed above the +DI and the ADX is rising near to 40. The MACD is making lower lows and lower high and MACD has crossed the zero line and is blow the zero level. RSI and Stochastic both are in oversold region and may remain their as the sentiments are bearish and more selling may come. The next level of support is 4944.      

01 February 2011

S&P CNX NIFTY


The nifty has fallen in down trend.It is trading below 200 day simple moving average. The RSI is making lower lows and lower highs the same is true for the MACD. RSI is trading blow 50 level and is at 28.91 and MACD is trading blow the zero line. All this indicate that bears are winning the game and dragging the nifty downwards. Once the important level of 5400 is breached, the weakness will be more visible and the next support level will be 5210.

26 January 2011

French CAC 40 Index

French CAC 40 Index is in up trend. It is trading above all the three simple moving averages say 20 day, 50 day and 100 day, same is true for 200 day moving average. The RSI is heading towards the overbought zone say above 70 level. The slow Stochastics has entered the overbought zone say above the 80 level. MACD is all ready above the zero line. All this shows that the bulls are dominant and the up trend will remain intact though some correction may take place.

25 January 2011

Shanghai Stock Exchange Composite Index


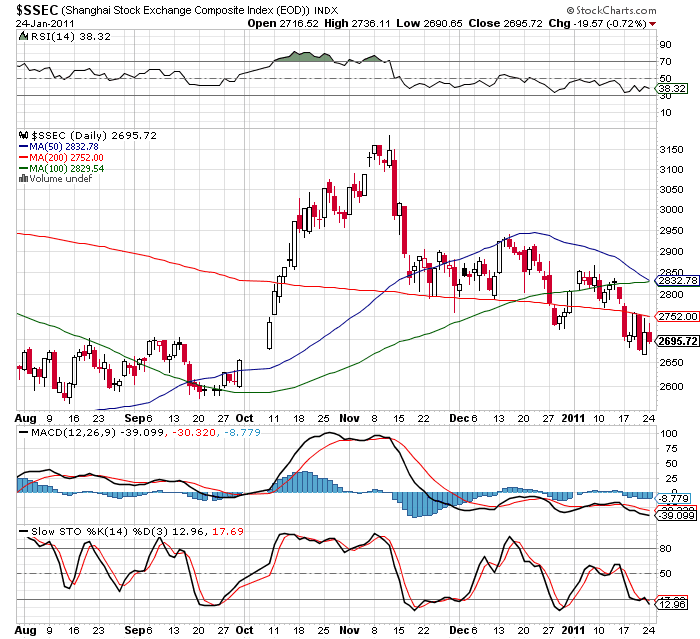
The Shanghai Stock Exchange Composite Index has fallen in down trend. It is trading blow all the simple moving averages say 50 day, 100 day and 200 day, The down trend is confirmed by making lower lows and lower highs. The RSI is making lower lows and is below the 50 level. MACD has crossed the signal line and trading blow the zero line.Slow Stochastics is also making lower highs and is in oversold region. The bulls have lost fight in the hands of bears. The next support level is at 2564.

22 January 2011

Tokyo Nikkei Average Index

via StockCharts.com

The Nikkei is correcting. It has been in up trend since September 2010. Recently the RSI has touched the 70 level and started to fall down and currently at 45.27. MACD has crossed the signal line below. Slow stochastic has dropped from the over bought region and is below 50 level. All are the bearish signs. The correction can be deeper. If Nikkei breaks below the support provided by the 50 day simple moving average at 10204.81 then the next support will be at 9896.79 by 200 day simple moving average. The overall structure of Nikkei is positive and there is no reason of worry until it breaks through the support provided by 200 day simple moving average.